There are many ways to measure the effectiveness of GeoFli. We like to encourage our customers to measure more than just impressions. Here’s a quick background on setting up a Google Goal and measuring the impact of content replacement tools. GeoFli can measure descriptive statistics of your personalized pages in-app by simply navigating to the analytics screen. Additionally, we encourage folks looking for more in-depth analytics to integrate Google Analytics with their GeoFli account. Creating a Google goal can help quickly illuminate the effectiveness of your personalization campaign.
Once you have a Google Goal in place, you can now begin to measure the conversion rate between your GeoFlied areas and your non GeoFlied areas.
Is GeoFli Working?
The fastest way to look and double check if GeoFli is firing and displaying personalized content is to use the in-app analytics screens.
In the application, you’ll see the Analytics screen at the top of your dashboard. If you have the GeoFli pixel active on your site, your screen will look something like this:
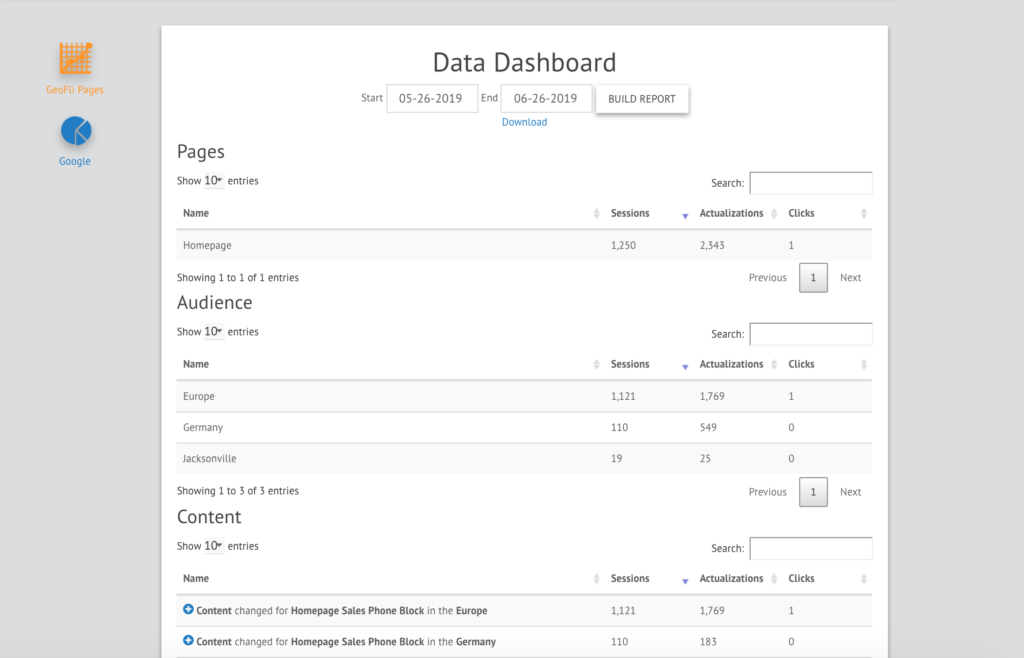
Sessions: These are the number of visitors that came to your site from your personalized location. For example, if you’re targeting a 50 mile radius of Salt Lake City and last week, you had 5,000 visitors from that radius to your site, you had 5,000 GeoFlied sessions.
Actualizations: This measures the number of personalized content blocks your viewers have seen. For example, if you change three pieces of content on a site and you have 300 visitors, they would have seen 900 personalized pieces of content: 900 actualizations.
Clicks: Clicks measure when someone clicks on any of your GeoFlied content. For example, if you’ve changed a link in a call-to-action button or a sub-header, clicks will measure how many times that personalized link was clicked.
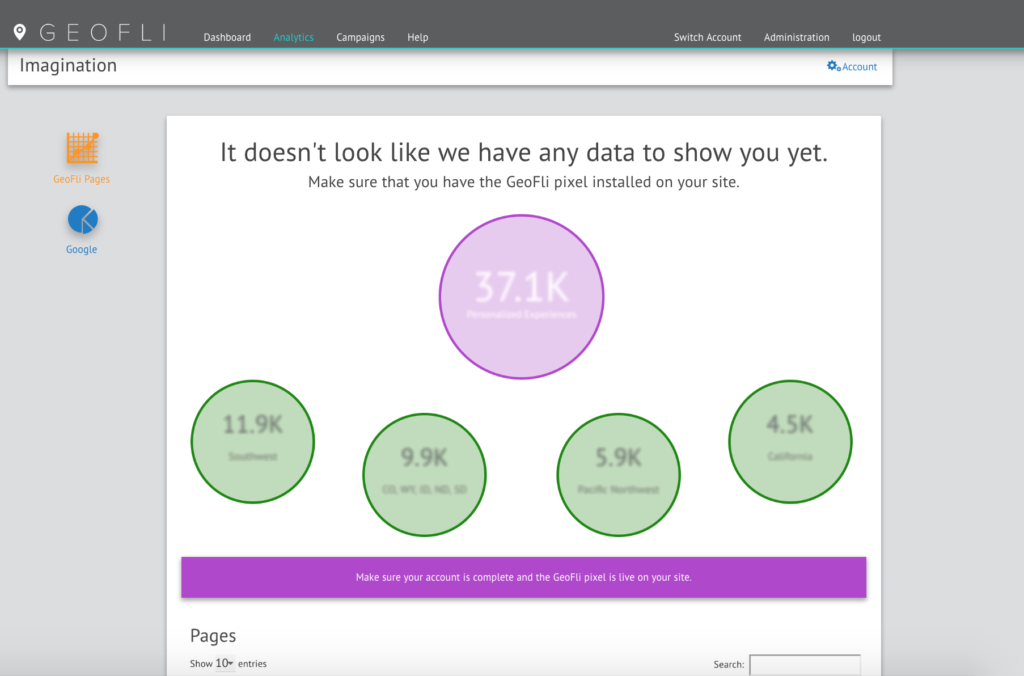
If you don’t have the pixel installed on your website yet, you’ll get the default Analytics screen encouraging you to drop the pixel and start tracking.
Connecting Google Analytics:
When you select Google on the left navigation on the analytics screen, you’ll be given the opportunity to connect your existing Google Analytics account to get even more data on your GeoFli activity. We recommend using this screen in combination with any Google Goals or conversions you’ve set up in your Google Analytics dashboard.
AB Testing: It’s important to understand
Creating Google Data Studio Reports:
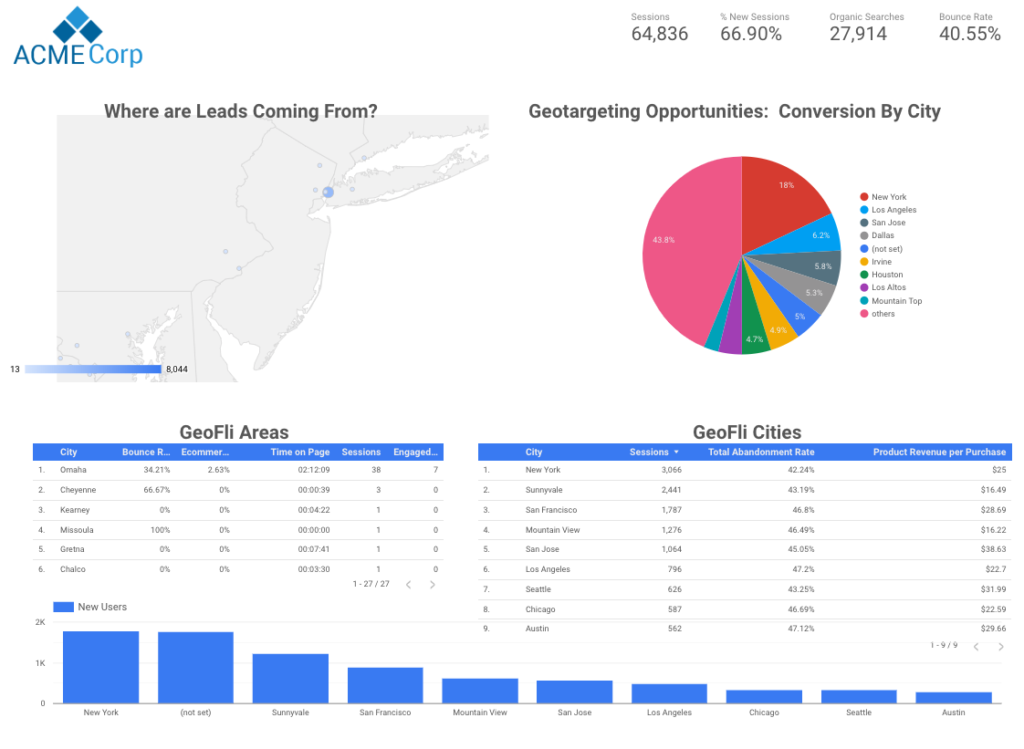
Google Data Studio is a powerful reporting software that can be personalized to fit all of your needs. We know that each GeoFli account has different reporting metrics that are essential that our internal dashboard might not provide. We recommend in these cases creating a simple Google Data Studio dashboard. Here’s an article we put together about reporting location data using Google Data Studio.
Our favorite method for tracking GeoFli is comparing site traffic to the traffic of your GeoFlied regions. For example, if you’re targeting Texas with personalized imagery, call-to-action-buttons and more, it might be beneficial to create two segments: one with all website traffic excluding Texas, and one segment that only includes Texas and compare side-by-side. Here’s an article that goes in-depth on segmenting.